Research article / Open Access
DOI: 10.31488/bjcr.205
A Unique Set of Physiological Changes which Causes Breast Cancer: A Discovery with a Novel Method of Finding Non-Infectious Disease Causes which Combines Multiple Research
Alan Olan
*Corresponding author: Dr Alan Olan, Email: alanolansci@gmail.com
Abstract
Breast cancer, the second leading cause of cancer-related death among women in the United States, accounts for approximately 30% of all new female cancers annually. Despite extensive research, the exact causes of breast cancer remain unclear. This study applies a novel mathematical algorithm-originally introduced in the article “Method of Combining Multiple Researches to Determine Non-Infectious Disease Causes”-to identify the physiological causes of breast cancer through the analysis of multiple risk factor studies.The method integrates findings from over 29 published studies on breast cancer risk factors, biochemistry, and physiology. It uses statistical and mathematical principles to isolate a minimal set of physiological changes that, if coexisting beyond a critical threshold (approximately 1-sigma deviation), inevitably trigger the disease. These physiological changes are identified through a filtration process that distinguishes true causative factors from general risk factors using predefined disease causation criteria.The analysis reveals a core combination of four physiological parameters that must simultaneously deviate beyond the 1-sigma threshold to initiate breast cancer: increased DNA strand breaks, elevated TNF-alpha, increased leptin levels, and high estradiol. A hypothesis for breast cancer pathology is derived, suggesting that a disruption in DNA damage and repair homeostasis is central to disease onset.This model offers a potentially transformative approach to early detection, prevention, and treatment by enabling identification of high-risk individuals before clinical symptoms or imaging findings emerge. Furthermore, it provides a framework for repurposing or combining existing medications based on the discovered physiological patterns. The method’s adaptability allows other researchers to apply it to various non-infectious diseases using a simple algorithm and existing research data.
keywords: disease causes, breast cancer, non-infectious disease, multiple research, frequency, disease causing factor, prevention, root cause, disease rate, physiological parameter, method to find a cause
Introduction
In article [1] “A Connection between Factors Causing Diseases and Diseases Frequencies: Its Application in Finding Disease Causes” [1] we introduced a model of non- infectious disease. According to this model which is matching to empirical evidence, the non-infectious disease is caused by changes to multiple physiological parameters when their values go beyond 1-sigma interval, slightly less actually. This means a non-infectious disease must occur if 2 or more particular physiological parameters changes beyond 1-sigma exist for while at the same time. Also, based on the model the criteria was introduced to determine if a risk factor is causing a non-infectious disease or not. In order to be a cause of non-infectious disease the risk factor K calculated as (RR - 1) or (OR-1) to be 3.55+/-50% ( or 355%+/-50%) if the factor is causing a change in 1 physiological parameter, and should have value of 19.67+/-50% (1967%+/-50%) if it is causing a change to 2 physiological parameters beyond 1-sigma.We call these conditions a Disease Causation criteria. The Disease Causation criteria determines whether a factor is one of multiple which are causing disease. The disease causing factor cannot cause a disease as a standalone as per model in article [1] because it is usually changing only 1 physiological parameter out of multiple required. Non-infectious disease, as per the model presented in article [1], is caused by multiple physiological parameters changed beyond 1-sigma.

The article [1] introduced a formula to calculate number of non-infectious disease causes if the disease rate (incidence rate usually) is known for the disease in a specific population. The formula is shown below ( n is number of disease causes (as number of physiological parameter changed beyond 1-sigma) : (1.0)
In this formula P(D) is usually represented by incidence rate of non-infectious disease (annual disease rate). Using formula 1.0 and Disease Causation criteria it was shown how to find physiological parameters changes which are causing some non-infectious diseases. In this article we introduce a method which is based on this model, which allow researchers to analyze an existing research about a specific non-infectious disease and determine a full set of disease causing physiological parameters for a non-infectious disease in much more complicated cases. Also, a method would allow to map a found disease causing factor to a physiological parameter which is changed by the factor beyond 1-sigma interval. For example, if we know that Diabetes is a disease causing factor for Hypertension there is a need to know which specific physiological factor impacted by Diabetes is really a cause of Hypertension. There are multiple physiological factors impacted by Diabetes and the method will allow to find a single one out of so many (allows finding “a needle in a haystack”) which is really causing Hypertension.
The method we introduce is based in math and those who mathematically inclined can find its foundation in the Appendix of this article. Here we will introduce a basic idea of the method and steps on how to practically use it.
Method
A method is introducing an algorithm based in math (but not requiring to use it much) which allows to process data from results of existing medical researches in few steps and produce a new information which consist of disease causes represented by a set of physiological parameters changes beyond 1-sigma (slightly less, actually) and also, a few separate groups of disease causing external factors. These few groups of factors are such that if you take a disease causing factor from each group as a standalone it will not cause a disease but combined together with factors from all other groups must cause a non-infectious disease.
Let’s say using the formula for a number of Disease causes (1.0) we found the number of causes as physiological parameter changes beyond 1-sigma. We also found from an existing research a few factors which are really causing a specific disease using a Disease Causation criteria provided. Now we need to determine which specific physiological parameters are really causing a disease. We only know their number and don’t know yet what they are. We know the factors which are causing a change to these physiological parameters and we can use them to find these unknown parameters.
In order to do this we need to list many physiological parameters related to the factor and we can find them from existing scientific research ( for example, we can look for all biomarkers of Diabetes and list as many as we can find). Once we list the physiological parameters in the header of some table we need to list the factors found to be causing the disease along a most left column ( vertically) of the same table. Based on the researches’ data we already know which physiological parameters are related to those factors causing disease and we mark the intersection between the factor and the related parameter with letter “R” (or other letter). Please note, we use a term “related” as it is unknown if the physiological parameter change is a cause a disease or not yet and all we know is that its change is present if the factor is present. Now we start analyzing which factors are having same parameter in common and we will call it an intersection if unrelated disease causing factors A and B both having the same physiological parameter changed. We need to find all these intersections. Those intersections will be a superset of the physiological parameters which are causing a disease. The details of why this happens are provided in a detailed math explanation in this article. Here we can say that a match in just one physiological parameter changed (important: we looking for a match by name, not by value) between 2 different factors is not a random coincidence but a pattern. This pattern is determined by a fact that factors are causing a change of the physiological parameter beyond 1-sigma interval ( or sometimes by other reasons explained later).
Here is a simplified explanation how the method works. Suppose there is a non-infectious disease with 2 unknown disease causes (quantity of 2 we have determined using formula 1.0). Suppose we determined already 2-3 disease causing factors (we can do it using Disease Causation criteria).Each disease causing factor is changing physiological parameters randomly beyond their original(or normal) range which means a quantity of physiological parameters changes is random, the parameters’ names, values are different as well, etc. The physiological parameters changes for a disease causing factors are random as they cannot be determined unless we do an experiment and determine what they have changed under influence of each of these disease causing factors (we assume we do an experiment first time). Note, the physiological parameter changes are random for a disease causing factor but they may be almost the same for different people impacted by this factor.
Suppose via the experiments we found that a disease causing factor 1 has changed 20 different physiological parameters beyond their original (or normal) range and a disease causing factor 2 has changed 50 different physiological parameters beyond their original (or normal) range. We just explained that only 2 unknown physiological parameters are really causing this disease. In order to determine their names we use a fact that due to random “selection” of physiological parameters out of so many ( few thousands and more exist in human body) by unrelated disease causing factors, a match by their names and values between these 2 groups of physiological parameters practically is not possible by accident ( this is shown mathematically in this article). If we find a match of physiological parameters by name it is a pattern under these specified conditions, it is not random. For example, if one type of disease causing factors (suppose a chocolate consumption) is causing a change in hemoglobin levels and a totally different disease causing factor (suppose a long exercising) is causing a change in hemoglobin levels as well then it is a pattern under these specified conditions.It becomes a pattern which we are interested in because it happens between groups belonging to 2 different disease causing factors.
We know these 2 disease causing factors are impacting same physiological parameter, meaning a parameter with the same name. For this reason, in order to find a pattern ( in our case a disease causation physiological parameter ) we need to find a place where 2 physiological parameters changes in both groups are the same by name (important: not by value) for these 2 different disease causing factors. This place where 2 disease causing factors have the same name of physiological parameter changed beyond original(or normal range) we call “an intersection”. If we found such a match between physiological parameters by name (important: not by value) we found a pattern - a physiological parameter which is causing a disease. See a Figure 1. Also, in Appendix 1 we provide a simple analogy which could help to clarify or visualize the explained concept further.
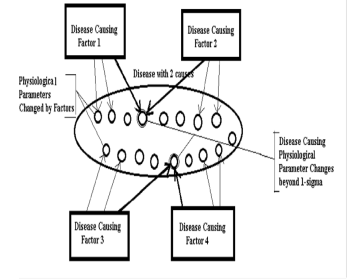
Figure 1: (Disease with 2 causes, as per formula (1.0): Disease causing factors are causing multiple physiological changes. Disease causing physiological changes are common for Factors 1 and 2, for Factors 3 and 4.We find them by determining an intersection in a physiological parameter)
When we find all these intersections we will find a list (or a matrix) of the parameters which are superset of physiological parameters which changes go beyond 1-sigma and are causing a disease. As there might be other patterns causing a match in parameters the number of parameters can exceed the number of parameters we determined via Number of Disease Causes formula (1.0). We will need to eliminate other parameters based on the methods provided in this article to get a final set of Physiological Parameters which changes go beyond 1-sigma ( actually slightly less).These changes when they are present at the same time must trigger a disease. The illustration of this process shown on Figure 1.
Once we know the final set of these physiological parameters and as we know up front which factor is related to which physiological parameter we can find which specific physiological parameter is impacted by the specific factor in such a way that a parameter goes beyond 1-sigma interval. In other words we get an understanding that a factor is impacting a specific physiological parameter. Now, if an individual is affected by a set of factors which are causing a change in ALL these physiological parameters required then the individual will get sick after sometime unless the harmful factors are removed fast enough. This knowledge can help to prevent a disease in the individual or help potentially cure it or reduce severity of the disease.
Using a method in practice
In a nutshell, in order to use this method to find a set of physiological parameters which are causing a disease next steps should be taken:
1. Find the number of causes (as physiological parameters changes) for the non-infectious disease using a formula for a disease causes (1.0) (see also our article: , “A Connection between Factors Causing Diseases and Diseases Frequencies: Its Application in Finding Disease Causes”, [1]
2. Find as many as possible, the factors which are causing a disease using a Disease Causation criteria on existing experimental data or new research (see our article: “A Connection between Factors Causing Diseases and Diseases Frequencies: Its Application in Finding Disease Causes”, [1]
3. For each factor found, you need to list as many as possible parameters related to it in some table. For example, if a factor is a consumption of some food then include which nutrients, chemicals it contains including harmful ones as per existing researches. If a factor is a disease then list which physiological parameters are known to be impacted one way or another as a symptom, a cause, etc. You need to place one factor vertically and appropriate impacted physiological parameters horizontally( in the table’s header) in this table. The column where a factor is related to a physiological parameter can be marked with cross “X” or letter “R”.
1. If the factor is by itself a physiological parameter it can be taken as one of the physiological parameters you are searching for during this step in the method. It can be corrected with next step if needed.
2. Now, you need to find where the columns which contain physiological parameters are causing a crossing between factors. This means you need to look for a cross ( “X” sign) in the same column for 2 or more factors in the table. We are basically finding which same (by name, not value) physiological parameter is changed by 2 disease causing factors.
3. Build a list or a matrix Pm consisting of the parameters which are causing intersections. For example, like Pm: { r1, r19, r23, r45 }. In practice Pm can look like Pm = { “Blood Pressure”, “Estrogen Level Change”, “Oxygen level”, “ROS level” }
1. Eliminate redundant physiological parameters from matrix Pm if required ( as per rules provided in this article). If the number of calculated parameters per formula (1.0) is less than number of parameters found via analysis of intersections then the redundant parameters need to be eliminated. The number of parameters found via analysis of intersection in a table should match to the number calculated via a formula (1.0) or be less if not all parameters can be found due to a lack of experimental data, etc. Also, if some physiological parameters found as result of analysis of intersection in a table are causing some disease causing factors to change more parameters then predicted by disease causing criteria then some physiological parameters may need to be eliminated as well. The disease causing factor can usually change only 1 or 2 physiological parameters beyond 1-sigma interval ( slightly less than this interval, actually).
2. Verify the results of using algorithm by checking if there are appropriate experimental data consistent with the physiological parameters found. Also, you can verify if a physiological parameter found satisfies a Disease Causation criteria above if there is any research on the risk of this parameter.
You can see that a method allows to use a simple algorithm on a set of existing experimental data in order to determine disease causes (as a set of physiological parameter changes beyond 1-sigma interval) and then verify the results using other research (which was not used doing steps of the algorithm) either by using Disease Causation criteria or by simply checking how this research is consistent with results of your findings.
Example of method’s application for a disease with 2 causes
Let’s look at hypothetical disease with 2 causes and apply to it the method described above. We created a Table 1. We can see in Table 1 that all physiological parameters are listed on the top and all found from the experiments Factors which are causing this hypothetical disease are listed on the left. Now, we can see that parameter r20 is an intersection for Factor 3 and Factor 4, param r12 is an intersection for Factor 2 and Factor 3 and Factor 4. A param r17 is an intersection for Factor 1, Factor 2. We can build our matrix Pm : { r12, r20, r17 }.
In practice, this matrix may look like a list Pm : { ‘Blood Pressure Change’, ‘Oxygen Level Change’, ‘Estrogen Change’ ). This matrix contains physiological parameters which changes beyond 1-sigma are causing a disease if present at the same time.
Now, we see the matrix Pm : { r12, r20, r17 } has 3 elements but our disease only require 2. We need to eliminate the incorrect one. We can notice that if we take a valid combination of 2 param as {r12, r17 } then a param r12 is showing that Factor 2 is impacting r12 and r17 parameters but Factor 2 only can cause 1 parameter impact (as determined by Disease Causation criteria) so the combination is not correct. If we eliminate r12 and take a combination of {r20, r17 } then both params are satisfying our requirement (assuming there is no info their changes are within 1-sigma). So from this table we can see that final physiological parameter’s set which is causing this disease is {r20. r17 }.In this case Factors 3 and 4 are causing a change in parameters r20, Factor 1 and 2 are causing a change in physiological parameter r17. We has determined 2 physiological causes for a disease with 2 causes.
Criteria for choosing intersections of physiological parameters
As we could see there is a very small chance of random intersection of physiological parameters belonging to 2 different factors and also, there are cases when more parameters found then determined by disease causation criteria. In order to select those parameters which are really causing a disease we need to use these criteria below.
1. We need to check if factors which are impacting physiological parameters found to be intersections are belonging to same type of disease or they are very similar in nature (like BMI impact and high weight impact) and we can ignore them as the intersection is most likely due to similarity.
2. Make sure a factor is causing a change the physiological parameter which intersect (not opposite) As the factors should cause a change in physiological parameters..
3. Make sure both factors are causing change in the physiological parameter which intersect or the intersection is not valid.
1. If a factor causing insignificant change (less 1-sigma interval) in physiological parameter then the parameters need to be ignored as a point of intersection with this factor. The factors as we discussed need to make change in physiological parameter so its value will be beyond 1-sigma interval.
2. Make sure the physiological parameters changes in the point of intersection happen in the same direction ( either increase or decrease). If the changes move in different directions then the parameters are considered as 2 different parameters and not as one.
3. The intersection of parameters for a similar factor is not considered correct intersection (as it is the same factor, for example Increased Weigh and BMI over 30 are similar factors)
4. If the experiment found that a factor which causing a disease is impacting 1 physiological parameter but the factor consists of combinations of 2 separate factors (for example observation was done for presence of diabetes or obesity together so they work as a factor) then the combined factor can be allowed to have 2 intersections despite having impact on 1 physiological parameter as one of the parts of the factor could be present at the time (for example either a diabetes causing 1 change in physiological parameter or obesity causing the change in another physiological parameter)
5. Element cannot cross itself, for example if factor is IgA and physiological parameter IgA then they don’t create a crossing. Usually, if a factor found as physiological parameter then we already know this is a physiological parameter causing a disease.
6. In many cases it is possible to eliminate the redundant intersection by determining via a known research if the physiological parameter increases or decreases with the presence of specific factor. For example, does lipoprotein level decreases or increases with diabetes as causation factor? If same parameter where we see a intersection, increases in presence of one factor and decreases in presence of another then the intersection is invalid.
7. Once a set of physiological parameters was found they can be also validated with already provided Disease Causation criteria to determine if the factor is a cause of disease ( a parameter should increase a risk of disease 3.5 +/-50% times) using an existing research. For example, if we find that an increased lipoprotein is causing a stroke and if some existing research confirms that a risk of its increase is 3.5 +/-50% then it confirms a lipoprotein as a parameter was found correctly.
8. In some cases biochemical analysis may help to eliminate an element from matrix Pm
Algorithm to eliminate redundancy
An approximate algorithm which can be used to eliminate redundant physiological parameters may look like this:
1) Find out if all parameters which intersect in your table satisfy a hard condition that a factor only can cause as many changes to physiological parameters as determined via a disease causation criteria (which in most case is 1 and in some 2 or very rare 3).If some physiological parameters are causing not permitted number of changes by a disease causing factor then some parameters need to be eliminated (ignored as intersections).
2) Check the factors which having intersections. If the factors are similar or related then their intersections can be due to similarity and ignored.
3) Select a set of physiological parameters which from a common sense will make most of factors intersect in them. Validate if your selection is following a rule number 1) above. If not use the elimination criteria provided in this article to help resolve conflicts.
4) If 3 factors which are not related intersect in the same physiological parameter then treat a physiological parameter as a high priority intersection as it is extremely low probability that this intersection is not a pattern.
5) If a physiological parameter is selected as a real intersection surround it with a bold rectangle to differentiate from original intersections.
6) Remember that if 2 factors intersect it is a pattern which is determined by next facts 1) that factors are causing a same changes beyond 1-sigma to a physiological parameter or 2) the intersection occur due to dependency between related factors or related physiological parameters but the changes are not necessarily beyond 1-sigma. In other words in this case the intersection happens due to this relationships not necessarily due to 1-sigma change ( but it can be both at the same time: due to relationship and also due to 1-sigma change).
Methodology
Analysis of Non-Infectious Disease Causes
Below we provide analysis Breast Cancer causes as per method presented above. Using this example we demonstrate in more details how to use the method.
1. Breast Cancer: Determination of Causes
Breast cancer is the common term for a set of breast tumor subtypes with distinct molecular and cellular origins and clinical behavior. Most of these are epithelial tumors of ductal or lobular origin. Breast cancer happens when there are changes in the genetic material (DNA). Often, the exact cause of these genetic changes is unknown.
In USA ( Pennsylvania state) the rate of new breast cancers (incidence rate) between 2016-2020 was 130.6 per 100000 women ( CDC, “Rate of New Cancers in the United States”, https://gis.cdc.gov/Cancer/USCS/#/AtAGlance/ ). Calculating number of causes using formula (1.0) presented above we get: N = = ~ 4
As per calculations above in USA the breast cancer happens due to 4 physiological parameters changes beyond 1-sigma and taking place at the same time. As shown in article [1] despite the different incidence rates in different populations this number will stay the same.
Let’s list the factors which are causing a Breast Cancer and explain how they are determined based on Disease Causation criteria provided above and developed in article “A Connection between Factors Causing Diseases and Diseases Frequencies: Its Application in Finding Disease Causes” [1]
1) A study shows: “The risk of breast cancer approximately doubled among subjects with blood levels of β-carotene at the lowest quartile, as compared with those at the highest quartile (odds ratio = 2.21; 95% confidence interval (CI): 1.29, 3.79).”, “The odds ratio for the lower quartile of total carotenoids was 2.31 (95% CI: 1.35, 3.96). “ ( ”Serum Carotenoids and Breast Cancer”, Paolo Toniolo, Anne Linda Van Kappel, Arslan Akhmedkhanov, et al, American Journal of Epidemiology, Volume 153, Issue 12, 15 June 2001, Pages 1142–1147 ”). We get OR=2.31 for total carotenoids and this within a range of Disease Causation criteria for one physiological parameter change which is 4.5+/-50%( 2.27- 6.81). This means that low total carotenoids is a disease causation factor which impacts one physiological parameter out of 4 required to cause the Breast Cancer as per Disease Causation criteria. It won’t cause Breast Cancer as standalone factor, it will need other 3 causes out of 4 to be present to cause a Breast Cancer. It is interesting to notice how long it takes for the breast cancer to develop after observing low carotenes: “The time delay between the dates of blood sample and diagnosis among the 270 cases ranged between 6 months and 11.2 years (mean, 4.0 (standard deviation, 2.4) years; median, 3.7 years).”. It shows that to accumulate 3 other required factors causing the Breast Cancer it has required up to 11.2 years ! But if all factors exist it may take as less as about 6 months to develop breast cancer. We place this disease causation factor in Supplementary Table 1 header, column 8.
2) Another study shows: “Women with cystic breast disease experience a 2-3 fold increase in risk for breast cancer” (“Henderson BE, Pike MC, Bernstein L, Ross RK. 1996. Breast Cancer, chapter 47 in Cancer Epidemiology and Prevention. 2nd ed. Schottenfeld D and Fraumeni JF Jr.,eds. Oxford University Press. pp: 1022-1035. ). If we take OR=3 then it is within a range of Disease Causation criteria for OR which is 4.5+/-50%( 2.27- 6.81). It means that cystic breast disease is 1 causation factor for Breast Cancer which impacts one unknown physiological parameter to change beyond 1-sigma interval so it causes Breast Cancer when combined with 3 others out of 4 determined. Cystic breast disease cannot cause Breast Cancer as standalone, it requires 3 other causes to be present at the same time to trigger Breast Cancer in women as per model presented in article [1] by Olan et al.We place this disease causation factor in Supplementary Table 1 header, column 3
3) Another study shows that Breast Cancer risk increases with increase in breast density: “Using women with BI-RADS density code 1 as baseline; women with cod e 2 had RR 1.69 (95%CI 1.56-1.84); women with code 3, RR 2.06 (95%CI 1.89-2.25); and women with code 4, RR 2.37(95%CI1.05-2.74).” ( “Breast density and risk of breast cancer”, Elsebeth Lynge, Ilse Vejborg, Martin Lillholm, et al, Int J Cancer. 2023 Mar 15; 152(6): 1150–1158, doi: 10.1002/ijc.34316 ). We can see that women with BI-RADS code 4 have RR = 2.37 which is within Disease Causation criteria 4.5+/-50%( 2.27- 6.81). It means that having density of breast in BI-RADS code 4 is one causation factor of breast cancer. It mean this is a factor which is impacting one physiological parameter change beyond 1-sigma interval (actually, slightly less). This factor cannot cause a breast cancer as standalone as it impacts only 1 physiological parameter change and for Breast Cancer as we determined 4 physiological changes beyond 1 sigma are required). We add this factor to Supplementary Table 1 header in column 7.
4) A study shows: “Among women aged 50–59 years, with a fat intake in the lowest quartile, the risk of breast cancer increased with increasing consumption of alcohol. A consumption of 24 g or more per day was associated with an 18-fold increased risk compared with abstainers. For women in other age groups, alcohol consumption had no significant association with breast cancer risk.” (“Alcohol consumption and breast cancer risk in Denmark.", Ewertz, M. Cancer Causes Control 2, 247–252 (1991). https://doi.org/10.1007/BF00052141). We take OR = 18 here, that means risk factor K = OR -1 = 17 and for K risk factor the Disease Causation criteria which is related to 2 physiological parameter changes is 19.67+/-50% (9.84-29.47) as per article [1] so the OR = 18 (K = 17) is within the range for Disease Causation criteria. It means the alcohol consumption in women under the conditions above is a disease causation factor for Breast Cancer which impacts 2 physiological parameters to go beyond approximately 1-sigma interval (actually, it is slightly more narrow interval than 1-sigma). We are adding this factor to Supplementary Table 1 header in column 9.
5) A study shows: ”...early follicular blood samples from breast cancer cases (n=197) in the Nurses Health Study II (NHSII) demonstrated a significantly elevated breast cancer risk in women with higher total and free estradiol (RRQ4 vs. Q1= 2.1; 95% CI, 1.1–4.1; and, RRQ4 vs. Q1= 2.4; 95% CI, 1.3–4.5; respectively). Importantly, the magnitude of the effect estimate was more pronounced among the ER+/PR+ cases compared with all breast cancer cases (RRQ4 vs. Q1= 2.7; 95% CI, 1.2–6.0 for follicular total estradiol)”(“Estrogen metabolism and breast cancer.”, Samavat H, Kurzer MS., Cancer Lett. 2015 Jan 28;356(2 Pt A):231-43. doi: 10.1016/j.canlet.2014.04.018 ).”. As we can see RRQ4 vs. Q1= 2.4 is within a Disease Causation criteria for 1 physiological change 4.5+/-50%( 2.27- 6.81). It means a high level (4th quartile) of free estradiol is a disease causation factor for Breast Cancer impacting one physiological parameter out of 4.It won’t cause a Breast Cancer as standalone factor but together with other factors ( which are impacting other 3 physiological parameters) being present at the same time must trigger the disease. We place the “Free Estradiol” disease causation factor in the header of Supplementary Table 1, column 1.
6) A study show: “Inflammatory breast cancer (IBC) has a rapid, aggressive disease course. A recent case‐control study from the Breast Cancer Surveillance Consortium database (1994‐2009) showed that obesity is associated with higher premenopausal IBC risk (RR, 3.62; 95% CI, 1.30‐10.04) for all cases and for those with ER‐positive (RR, 3.53; 95% CI, 1.20‐10.39) and ER‐negative (RR, 4.67; 95% CI, 1.45‐ 15.02) IBC. An older case‐comparison study that included 68 IBCs also reported that a BMI > 26.65 kg/m2 was associated with an up to 4‐fold higher risk of premenopausal IBC”. ( “Obesity and adverse breast cancer risk and outcome: Mechanistic insights and strategies for intervention.”, Picon-Ruiz M,
Morata-Tarifa C,et al, JMCA Cancer J Clin. 2017 Sep;67(5):378-397. doi: 10.3322/caac.21405. ). We see that for obesity RR = 3.62, RR =3.53, RR= 4.67 all satisfy Disease Causation criteria 4.5+/-50%( 2.27- 6.81) and it means that obesity is a causation factor for Inflammatory breast cancer which impacts 1 physiological change required to cause Breast Cancer out of 4 causes needed. We put this factor in Supplementary Table 1 header, column 11.
7) A study on free estradiol shows: “Data from 2 large studies demonstrated that postmenopausal women in the highest quintile of plasma free E2 experienced at least a 2.58-fold (95% CI 1.76–3.78) higher rate of breast cancer over the ensuing 10 years than those in the lowest quintile.” ( “Effects of estrogen on breast cancer development: Role of estrogen receptor independent mechanisms.” Yue W, Wang JP, Li Y, Fan P, Liu G, et al. Int J Cancer. 2010 Oct 15;127(8):1748-57. doi: 10.1002/ijc.25207. ). We can see that OR=2.58 is within range of 4.5+/-50%( 2.27- 6.81) and so per Disease Causation criteria the high level of free Estradiol in postmenopausal women is a disease causation factor of Breast Cancer impacting a change in 1 physiological parameter beyond 1-sigma. We put this factor in Supplementary Table 1 header, column 5.
1) A study of women women aged 50–79 which were not on hormone replacement therapy(HRT) showed: “Among HRT non-users, heavier women (baseline body mass index (BMI) > 31.1) had an elevated risk of postmenopausal breast cancer (relative risk (RR) = 2.52; 95% confidence interval (CI) = 1.62–3.93), compared to slimmer women (baseline BMI ≤ 22.6)” ( “Obesity, body size, and risk of postmenopausal breast cancer: the Women's Health Initiative (United States).”, Morimoto, L.M., White, E., Chen, Z. et al. Cancer Causes Control 13, 741–751 (2002). https://doi.org/10.1023/A:1020239211145). We see that RR=2.52 is within of 4.5+/-50%( 2.27- 6.81) and this means that being a heavy women (BMI > 31.1) is a disease causation factor for Breast Cancer which impact 1-physiological parameter to go beyond 1-sigma interval (actually, slightly less than this). We place this factor in Supplementary Table 1 header, column 2.
2) A study of rare germline variants in women shows: “We found evidence of association with breast cancer risk for four genes, with estimated adjusted ORs of 5.3 [95% CI: 2.1–16.2] for BRCA1, 4.0 [95% CI: 1.9–9.1] for BRCA2, 3.4 [95% CI: 1.4–8.4] for ATM and 4.3 [95% CI: 1.0–17.0] for PALB2” (“Population-based estimates of breast cancer risk for carriers of pathogenic variants identified by gene- panel testing”, Southey MC, Dowty JG, Riaz M, Steen JA et al, NPJ Breast Cancer. 2021 Dec 9;7(1):153. doi: 10.1038/s41523-021-00360-3 ). All ORs such as OR=5.3 for BRCA1, OR=4.0 for BRCA2, OR = 3.4for ATM , OR = 4.3 for PALB2 genes are within 4.5+/-50%( 2.27- 6.81) interval of Disease Causation criteria for 1 physiological parameter change and it means the mutations in those genes are causation factor for a Breast Cancer affecting 1 physiological parameter so it goes beyond approximately 1-sigma interval. This unknown parameter is 1 of 4 physiological changes beyond 1-sigma interval which are causing Breast Cancer if co-exist at the same time. It won’t cause the Breast Cancer standalone though. We will find those unknown parameters further. We place this genetic related factor in Supplementary Table 1 header, column 6.
3) A study on Estrogen replacement therapy in women reports: “ Current use of either oral estrogen alone or in combination with progestin pills was associated with increased risk of lobular cancer, with particularly high risk associated with current combination therapy (OR, 3.91; 95% CI, 2.05-7.44). Recent oral HRT use of 57 or more months was associated with a 3-fold increase in risk of lobular cancer (OR, 3.07; 95% CI, 1.55-6.06) and a 50% increase in nonlobular tumors (OR, 1.52; 95% CI, 1.01-2.29).” (“Hormone Replacement Therapy in Relation to Breast Cancer.”, Chen C, Weiss NS, et al, JAMA. 2002;287(6):734–741. doi:10.1001/jama.287.6.734 ). We see that OR = 3.91 and OR 3.07 are both within a range of 4.5+/-50%( 2.27- 6.81) interval of Disease Causation criteria for 1 physiological parameter change. It means that these kinds of estrogen replacement therapy is a causation factor for the breast cancer which changing 1 physiological parameter to go beyond 1-sigma and it is 1 out of 4 parameters required to cause the disease. Estrogen replacement therapy of this kind won’t cause a breast cancer as standalone factor, only with combination of other 3 physiological parameters. We place the found factor in Supplementary Table 1, column 4.
4) A study on anemia during a breast cancer says: “Multivariate analysis with all relevant prognostic factors in a Cox proportional hazards regression model showed that preoperative anemia was a significant prognostic factor in breast cancer patients (Table 4). T-status (≥T3), N-status (N1, N2), strongly positive PR status and HER-2 positivity were significantly associated with LRFS, and anemic patients had a 4.939-fold increased relative risk of developing local relapse compared with nonanemic patients.” ( ”Impact of preoperative anemia on relapse and survival in breast cancer patients.”, Zhang, Y., Chen, Y., Chen, D. et al. BMC Cancer 14, 844 (2014). https://doi.org/10.1186/1471-2407-14-844 ). We see that RR = 4.939 which is in range of 4.5+/-50%( 2.27- 6.81) interval of Disease Causation criteria. It means anemia in breast cancer patients is a causation factor for breast cancer relapse which impact 1 physiological change to be beyond 1- sigma. We place this factor in Supplementary Table 1, column 10.
With this we finished determination of factors which are causing Breast Cancer which we were able to discover in existing research. There can be other factors which are not known to us or which will be discovered in future research. The unknown factors still will impact the same set of physiological parameters which we will determine later in this process.
Now we need to find the physiological parameters related to the disease causation factors we found. We don’t know if their changes are causing the disease but we know the changes to these physiological parameters arepresent then the disease causation factors are present. Let’s list them here:
1) A study of women with a cystic breast disease (with simple and complex cysts) found: “The breast cyst fluid levels of leptin, adiponectin, and resistin were significantly decreased compared to plasma in both study groups. Contrarily, levels of visfatin/NAMPT and TNF-α in breast cyst fluid were significantly increased in relation to plasma in both study groups. In turn, IL-6 levels in breast cyst fluid and plasma were similar in both study groups.”( "Evaluation of Adipokines, Inflammatory Markers, and Sex Hormones in Simple and Complex Breast Cysts’ Fluid", Paweł Madej, Grzegorz Franik, Piotr Kurpas, et al, Disease Markers, vol. 2016, Article ID 5174929, 6 pages, 2016. https://doi.org/10.1155/2016/5174929.) We are adding physiological parameters “Leptin in breast much lower then in Plasma”, “Adiponectin lower”, and “Resistin lower” in most left column of Supplementary Table 1 and add letters “R” for them in column 3 for Cystic Breast disease and add “R” in the same column 3 across “TNF-alfa increase” parameter.. This will signify relationships between the Cystic disease as a disease causation factor and the physiological parameters changes observed when this factor is present.
2) Additional physiological change for Cystic Disease were reported in a study: “Breast cysts are associated with an increased risk of breast cancer. Some biomarkers such as estrogen receptor alpha (ERa), progesterone receptor (PR), and cyclin D1, show similar patterns of expression in epithelial cells lining breast cysts as malignant epithelial cells in local and invasive ductal breast cancer. ” ( “Microcysts and breast cancer: a study of biological markers in archival biopsy material.”, Tran DD, Lawson JS., Breast Cancer Res Treat. 2002 Oct;75(3):213-20. doi: 10.1023/a:1019969730552. PMID: 12353810.) We place these factors in the most left column of Supplementary Table 1 and put the “R” sign in the column 3 for a “Cystic Breast Disease” factor.
3) A study on Cystic breast reports: “ We identified two biomarkers, 15- hydroxyprostaglandin dehydrogenase and 3-hydroxymethylglutaryl-CoA reductase, that were expressed specifically by apocrine type I cysts as well as by apocrine metaplastic cells in type II microcysts, terminal ducts, and intraductal papillary lesions. No expression of these markers was observed in non-malignant terminal ductal lobular units, type II flat cysts” ( "Apocrine Cysts of the Breast: Biomarkers, Origin, Enlargement, and Relation with Cancer Phenotype",Julio E. Celis, Pavel Gromov, José M.A. Moreira, MCP, Volume 5, Issue 3, March 2006, Pages 462-483, https://doi.org/10.1074/mcp.M500348- MCP200 ). We add these 2 biomarkers to the most left column and add letters “R” across them in column 3 for “Cystic breast disease”
4) Another study on alcohol consumption states: “Muti et al. (1998) measured estradiol level in blood collected from premenopausal women during luteal phase on the same month, day, hour and minute 1 year apart and found a significant positive association between estradiol level and alcohol intake and a higher prevalence of drinkers in subjects with consistently higher estradiol level.” ("Sex hormones in alcohol consumption: a systematic review of evidence.", Erol A, Ho AM, Winham SJ, Karpyak VM., Addict Biol. 2019 Mar;24(2):157-169. doi: 10.1111/adb.12589. Epub 2017 Dec 27. PMID: 29280252; PMCID:PMC6585852). Also, another study states: “In this large study of premenopausal women, we observed higher luteal estrogen and SHBG concentrations and lower levels of free testosterone among women who consumed alcohol compared with nondrinkers.” (“Alcohol Consumption in Relation to Plasma Sex Hormones, Prolactin, and Sex Hormone–Binding Globulin in Premenopausal Women." Kelly A. Hirko, Donna Spiegelman, Walter C. Willett1, et al, Cancer Epidemiol Biomarkers Prev; 23(12) December 2014).We add “Estradiol increase” to left most column (if not added yet) and put the letter “R” in the column 9 for Alcohol consumption.
5) A study on alcohol consumption by women states: ”. results indicate that moderate alcohol consumption (15–30 g of alcohol per day) increases serum leptin levels in postmenopausal women” ( "Relationship Between Serum Leptin Levels and Alcohol Consumption in a Controlled Feeding and Alcohol Ingestion Study", Mark J. Roth, David J. Baer, et al, JNCI: Journal of the National Cancer Institute, Volume 95, Issue 22, 19 November 2003, Pages 1722–1725, https://doi.org/10.1093/jnci/djg090) We add letter “R” across “Leptin Increase”(if it is not there yet) parameter in Column 9 for ”...Alcohol consumption over 24 g”
6) A study on alcohol biomarkers states: “Alcohol is acutely as well as chronically toxic to the liver, and hepatic enzymes such as gamma-glutamyl transferase (GGT), alanine aminotransferase (ALT), and aspartate transaminase (AST) therefore leak into the blood as part of the toxic response to high alcohol intakes.” ( ”Biomarkers of moderate alcohol intake and alcoholic beverages: a systematic literature review.”,Trius-Soler, M., Praticò, G., Gürdeniz, G. et al., Genes Nutr 18, 7 (2023).https://doi.org/10.1186/s12263-023-00726-1). We are adding this physiological parameters to the most left column (if not added yet) and add letters “R” across them in Column 9 for ”..alcohol intake”.
7) Regarding an obesity in women a study says: “Adipose tissue is biologically active secreting adipokines, cytokines and estrogens. In the obese, a variety of hormonal, metabolic and inflammatory changes occur that promote the pathogenesis of breast cancer.” ( “Blood biomarkers reflect the effects of obesity and inflammation on the human breast transcriptome.”, Cho BA, Iyengar NM, Zhou XK, Morrow M., Carcinogenesis. 2021 Oct 26;42(10):1281-1292. doi: 10.1093/carcin/bgab066. PMID: 34314488; PMCID: PMC8546933.) We add these physiological parameters in the most left column of Supplementary Table 1 and add “R” letters in Column 11 for “BMI Higher 26.65 kg” factor.
8) A study on mammographic density (MD) informs: “When stratifying by menopausal status, progesterone was positively associated with baseline MD among premenopausal (+ 1.78 cm2 per doubling of hormone; P = 0.004) (Table 3), but not postmenopausal (− 0.07 cm2; P = 0.888), women (Table 4). SHBG was positively associated with baseline MD in both premenopausal and postmenopausal women (+ 6.58 cm2, P = 0.004; + 2.60 cm2, P = 0.042, respectively). Other hormones did not reach statistical significance in the stratified analyses” (“Hormonal determinants of mammographic density and density change.”, Gabrielson M, Azam S, Hardell E, et al, Breast Cancer Res. 2020 Aug 26;22(1):95. doi: 10.1186/s13058-020-01332-4). We add “SHBG” physiological parameter to the most left column and put “R” across it in column 7 for a Breast Density,
9) Another study on Breast Density states: “Both endogenous and exogenous estrogen may influence mammographic density. Mammographic density decreases after menopause when ovarian function declines. Hormonal replacement therapy, with combination of estrogen and progesterone, increases mammographic density [2], while tamoxifen, which has antiestrogenic effect, decreases mammographic density [3]. Mammographic density therefore can be regarded as a marker of the effect of estrogen on the breast tissue.” ( "Does breast density show difference in patients with estrogen receptor-positive and estrogen receptor-negative breast cancer measured on MRI?", Chen JH, Hsu FT, Shih HN, et al, Ann Oncol. 2009 Aug;20(8):1447-9. doi: 10.1093/annonc/mdp362 ). This dependency between estrogen and breast density is observed when there is a change in estrogen but the change in breast density is not consistently shows the change in estrogen so we put “Estradiol increases”(if it is not there yet) parameter in left most column and add letter “Rc” (as conditional dependency ) in column 7 for Breast Density. We also place letter “R” in column 4 for “Using Estrogen Replacement...” and column 5 for “Postmenapause high estrogen” as the estrogen level growth is observed in both of these cases.
10) A study on Breast Density and biomarkers in premenopausal women found: “Moderate positive correlations were observed among amino acids, acylcarnitines, and phosphatidylcholines (with respective average correlations of 0.40, 0.31, and 0.37, not tabulated) and were stronger among lysophosphatidylcholines and sphingomyelins (with respective average correlations of 0.57 and 0.67, not tabulated)” ( ”Biomarkers of mammographic density in premenopausal women.”, His, M., Lajous, M., Gómez-Flores-Ramos, L. et al, Breast Cancer Res 23, 75 (2021). https://doi.org/10.1186/s13058-021-01454-3). We add these physiological parameter changes in most left column of Supplementary Table 1 and add letters “R” across them in column 7 for “High Breast Density, BI-RADS code 4” to signify relationships between the physiological parameters and the disease causation factor.
11) According to research on anemia, anemia in cancers is related to TNF-α, GATA-1 , etc: “TNF-α inhibits hemoglobin production in a proportional fashion to the down-regulation of GATA-1 and also affects erythropoiesis induced by erythropoietin (Epo). TNF-α induces a decrease in the expression of FOG- 1, a co-activator of GATA-1, as well as a proteasome-dependent decrease of GATA-1. In addition TNF-α suppresses the acetylated form of GATA-1, the post-translational modification required for DNA binding.” ( "Anemia in cancer", M. Dicato, L. Plawny, M. Diederich, Annals of Oncology Volume 21, Supplement 7, October 2010 https://doi.org/10.1093/annonc/mdq284 ). We add “TNF-α increase” physiological parameter(if not there yet) in the most left column of Supplementary Table 1 and put letter “R” in column 10 for “Anemia in Breast cancer” as TNF-α increase is one of the causes of anemia and also we add “Down-regulation of GATA-1” as physiological parameter in the most left column and add “R” for this parameter in same column 7. Both these parameters changes can be observed in cancer patients with anemia.
5) An obesity increases inflammation and a study states: “In normal-weight individuals, M2 macrophages present in adipose tissue promote anti-inflammatory signals. However, obesity-related changes in adipocyte secretory profile (including, e.g., excess synthesis of interleukin 6 (IL-6) and tumor necrosis factor-alpha (TNFα)) attract pro-inflammatory M1 macrophages to perpetuate pro-inflammatory cytokine signaling to trigger adipocyte cell death.” ("Estrogens in Adipose Tissue Physiology and Obesity- RelatedDysfunction",KuryłowiczsA.,Biomedicines.2023,11(3):690.https://doi.org/10.3390/biomedicines1103 0690). As there is a dependency between being overweight and TNF-alfa increase and IL-6 increase we place these parameters in the most left column of Supplementary Table 1 and add “R” in column 2 for “Postmenopause Weight increase,BMI > 31.1” and column 11 for “Premenapause women with BMI Higher 26.65 kg / m^2”
6) Another study on obesity and leptin states: “IPA analysis identified leptin signaling as significantly upregulated in breast epithelial organoids from obese women compared with lean women. Both obese CM and leptin treatment induced DNA damage in BRCA1+/- MCF10A cells while lean CM did not have this effect.” ( "Leptin Mediates Obesity-Induced DNA Damage in BRCA1 Breast Epithelial Cells", Priya Bhardwaj, Rohan Bareja, Sofya Oshchepkova, et al, Journal of the Endocrine Society, Volume 5, Issue Supplement_1, April-May 2021, Page A1024, https://doi.org/10.1210/jendso/bvab048.2095 ). We add leptin growth as parameter in most left column and “R” for this parameter in column 2 for “Increased Weight” and column 11 for BMI Higher 26.65 kg.
7) A study on impact of hormone replacement therapy and leptin has found: “A positive linear correlation was found between leptin plasma levels and BMI only in obese patients (r = 0.58; p < 0.01) both before and after estrogen treatment” (“Leptin Levels in Menopause: Effect of Estrogen Replacement Therapy.”, Rosa Maria Cento; Caterina Proto, et al,Hormone Research (2000) 52 (6): 269–273, https://doi.org/10.1159/000023493 ). We are adding “Leptin level increase” (if not added yet) to the most left column and letter “R” to column 2 for “Postmenopause Weight increase, BMI > 31.1”
8) A study on carotenes informs on their impacts on decreased deoxyribonucleic acid (DNA): “In studies in which subjects were fed less than 25 mg/day of β-carotene, either from foods or as a supplement, changes in the markers for antioxidant activity were minimal. Exceptions noted were decreased deoxyribonucleic acid strand breaks observed when 22 mg/day of β-carotene was administered as carrot juice (Pool- Zobel et al., 1997) and lowered copper-induced oxidation of low-density lipoprotein when 12 or 24 mg/day of β-carotene was given along with vitamins C and E” ( “Dietary Reference Intakes for Vitamin C, Vitamin E, Selenium, and Carotenoids.”, Washington (DC): National Academies Press (US); 2000. 8, β-Carotene and Other Carotenoids. Available from: https://www.ncbi.nlm.nih.gov/books/NBK225469/). We place a “Increase in DNA strands breaks” as physiological parameter changed in the most left column of Supplementary Table 1 and put letter “R” accordingly in the column 8 for a “Low Total Carotenes” to signify a relationship between the physiological parameter changes and the disease causing factor.
9) An article on beta-carotene impact in healthy people informs: ”...daily intake of β‐carotene, a nontoxic antioxidant, reduces lipid peroxidation as assessed by serum lipid peroxide levels.”(“β‐Carotene decreases markers of lipid peroxidation in healthy volunteers.”, Gottlieb, K., Zarling, E. J., et al(1993). Nutrition and Cancer, 19(2), 207–212. https://doi.org/10.1080/01635589309514251). We add the an “Increase in lipid peroxidation” as physiological parameter in the most left column of Supplementary Table 1 and add letter “R”in column 8 (“Low Total Carotenes”) to signify a relationship between the physiological parameters and a disease causation factor..
10) An article on beta-carotenoids informs: “Provitamin A carotenoids are plant pigments that include beta-carotene, alpha-carotene, and beta-cryptoxanthin [1]. The body converts provitamin A carotenoids into vitamin A in the intestine via the beta-carotene monooxygenase type 1 BCMO1 enzyme [1,3,6], although conversion rates may have genetic variability” (“Vitamin A and Carotenoids.Fact Sheet for Health Professionals”, NIH, https://ods.od.nih.gov/factsheets/VitaminA-HealthProfessional/ ). We place a “Reduction of Provitamin A carotenoids” as physiological parameter in most left column of Supplementary Table 1 and add letter “R” in in Column 8 (“Low Total Carotenes “) to signify a relationship.
11) An article on BRCA1 gene states: “The BRCA1 protein is involved in repairing damaged DNA. In the nucleus of many types of normal cells, the BRCA1 protein interacts with several other proteins to mend breaks in DNA. These breaks can be caused by natural and medical radiation or other environmental exposures, and they also occur when chromosomes exchange genetic material in preparation for cell division.” ( "BRCA1 gene", National Library of Medicine, Medline Plus, https://medlineplus.gov/genetics/gene/brca1 ). Another article on BRCA1 and BRCA2 mutations states: “BRCA1 and BRCA2 play a crucial role in maintaining genome integrity by repairing double-strand DNA breaks via the homologous recombination repair (HRR) pathway. Any mutations that cause functional disruption of these proteins may prove to be highly deleterious, leading to the development of cancer. In addition, BRCA1 and BRCA2 also play a critical role in cell division where they are transported to the cytosol to participate in regulating various molecular events during mitosis. Mutations impacting these important functions of BRCA1/2 can affect the delicate balance of the tightly regulated cellular processes that may lead to progression of disease.” ("Role of BRCA Mutations in the Modulation of Response to Platinum Therapy.", Sanghamitra Mylavarapu1, Asmita Das,Frontiers in Oncology,Volume 8, 2018, https://doi.org/10.3389/fonc.2018.00016 ). We can place letter “R” across physiological parameter an Increased DNA strand breaks in a Column 6 (“BRCA1, BRCA2, etc gene mutations ( 1cs)”) as BRCA1 mutation may break this function of DNA Repair. This way we fill out the rest of Supplementary Table 1 with physiological parameters and mark relationships between them and the found disease causation factors with letters “R”. We can use small letter near “R” to signify some details of these relationship, for example “Rc” where c - as conditional relationship. These relationships will need to be further analyzed and made more precise if necessary. If it is required to increase a precision of conclusions about the physiological parameters causing a disease the additional research on disease causation factors or physiological parameters can be used in a similar manner as above. In order to simplify placement of letters “R” the table’s columns can be enumerated and this enumeration may need to be added in few places as such a table may get pretty long. Now we need to move to the next step of the method and for this let’s find out intersections (which we defined above) of the physiological parameters for the external factors which found to be causing Breast Cancer. We can see intersections in 4 rows in a Supplementary Table 1. They are rows with multiple letters “R”which are marked in a gray color. Based on the intersections observed in Supplementary Table 1 we include next physiological parameters in our matrix Pm below : Pm : { ”Increased DNA strand breaks”, “Estradiol increase”, “TNF-alfa increase”, “Leptin Increase” } . As we discussed in method’s explanation section, the first Pm matrix usually is not final and may require some corrections. We see our matrix Pm contains 4 parameters and it is the same as number of changes which are causing a Breast Cancer disease. So we don’t need to eliminate redundant physiological parameters but we need to notice the intersection for some of these physiological parameters cannot be correct because they would cause some factors to impact 2 or more physiological parameters while we have already determined above (using a disease causation criteria) that most of our disease causation factors for Breast Cancer must cause only 1 physiological change beyond 1-sigma and not more. We can see that a factor “Premenapause women with BMI Higher 26.65 kg / m^2 ( 1cs)” has crossings in 2 physiological parameters but can only cross 1 (as per disease causation criteria provided above). It currently impacts these physiological parameters as can be seen in Table 1.1: TNF-Alfa increase, Estradiol Increase . A physiological parameter “TNF-alfa increase” has 3 crossings (we don’t consider ”Postmenopause Weight increase,BMI > 31.1 ( 1cs)” and “Premenapause women with BMI Higher 26.65 kg / m^2 ( 1cs)” as different factors) and due to this the probability that this intersection in TNF- alfa is random is extremely low. Estradiol increase has 5 crossing and the probability of this crossings to be random is extremely low too. We need to see that causing this redundant intersection then? How to adjust our Pm matrix so all physiological parameter cross appropriately? We notice that “Premenapause women with BMI Higher 26.65 kg / m^2 ( 1cs)” disease causation factor is applicable to premenpause women and for them the estrogen production in adipose tissue is not playing a large role as for postmenopause women as in premenopause women estradiol secretion happens mostly in ovaries.So we can safely assume that despite the fact what adipose tissue can cause Estradiol increase in premenopause women the role of such an increase likely less than 1-sigma for this disease causation factor ( and we know also the factor can have only 1 impact). This leaves us with a change beyond 1-sigma in only 1 physiological parameter which is TNF-Alfa increase. It means that being “Premenapause women with BMI Higher 26.65 kg / m^2 ( 1cs)” is disease causation factor which impacts TNF-Alfa increase in premenopause women and this change is one of 4 physiological disease causes for a Breast Cancer.
Let’s notice how we used here a property that the physiological parameter should be changed beyond 1- sigma to cause a disease in order to remove a redundant crossing and correct matrix Pm. Now, we can also see an intersection in IL-6 in Supplementary Table 1 but we don’t consider it is a valid intersection as it is for a related factors ”Postmenopause Weight increase,BMI > 31.1 ( 1cs)” and “Premenapause women with BMI Higher 26.65 kg / m^2 ( 1cs)” both related to obesity. So our new and final matrix Pm stays the same but the Supplementary Table 1 updated properly with a bold frame to incorporate right physiological changes as per our discussion above. The final matrix Pm is : Pm : { ”Increased DNA strand breaks”, “Estradiol increase”, “TNF-alfa increase”, “Leptin Increase” }
Physiological Causes of Breast Cancer (Results of Analysis)
Based on the analysis of factors above the set of 4 physiological changes beyond 1-sigma which are taking place at the same time are causing a Breast Cancer disease. This set is as below.
1. Increased DNA strand breaks ( beyond ~ 1-sigma )
2. TNF-alfa increased beyond ~ 1-sigma
3. Leptin level increase beyond ~ 1-sigma
4. Estradiol increase (above ~1-sigma)
This means a particular women will get a breast cancer after some time if she continuously has Increased DNA strand breaks ( beyond ~ 1-sigma ) AND TNF-alfa increased beyond ~ 1-sigma AND Leptin level increase beyond ~ 1-sigma AND Estradiol increase (above ~1-sigma). This process resembles a fuse which always blew off if the electrical current exceeds the fuse’s limit. The only random factors here are either you turn on air conditioning or electrical iron. As soon as you exceed the limit of the fuse it will always blew off and it does not matter if the cause was the air conditioning or iron. It is not optional for the fuse to blew off. The same concept applies as we can see for a breast cancer or other non-infectious disease pathology.
The rows in Supplementary Table 1 surrounded by bold rectangles represent the physiological parameters found as result of analysis and which are causing Breast Cancer disease. Once they determined we can move these physiological parameters along with disease causing factors which are causing the change in them from Supplementary Table 1 to the Table 1.2. This table will contain the results of analysis: Disease Causation factors for Breast Cancer, physiological parameters which change beyond 1-sigma when these factors are present and relationship between Disease Causation factor and each physiological parameter.
Validation of Method’s Results for Breast Cancer
To verify we completed all the steps of the method correctly so far let’s take a look how an existent research is consistent with our findings of Breast Cancer causes. A research states: “Since DNA double-strand breaks (DSBs) contribute to the genomic instability that drives cancer development, DSB repair pathways serve as important mechanisms for tumor suppression. Thus, genetic lesions, such as BRCA1 and BRCA2 mutations, that disrupt DSB repair are often associated with cancer susceptibility.” ( "DNA double-strand break repair pathway choice and cancer."Aparicio T, Baer R, Gautier J., et al, DNA Repair (Amst). 2014 Jul;19:169-75. doi: 10.1016/j.dnarep.2014.03.014.). Which is consistent with our finding that Increased DNA strand breaks ( beyond ~ 1-sigma ) are one of 4 causes of Breast Cancer. It does not cause Breast Cancer standalone but requires 3 other physiological changes.
Another article on TNF-Alfa informs: “Collectively, these data reveal a pro-tumorigenic role of TNF-α during breast cancer progression and metastasis. We systemize the knowledge regarding TNF-α-related therapies in breast cancer”(“The dual role of tumor necrosis factor-alpha (TNF-α) in breast cancer: molecular insights and therapeutic approaches.”, Cruceriu, D., Baldasici, O., Balacescu, O. et al., Cell Oncol. 43, 1–18 (2020). https://doi.org/10.1007/s13402-019-00489-1). This is consistent with a discovery of TNF-alfa increase as one of the causes of Breast Cancer.
A study on Leptin states: “ It controls adipose tissue growth and cell proliferation including breast tissue.77 Leptin levels were related to breast cancer aggressiveness and can predict the type, grade, stage, lymph node involvement, hormone receptors, and recurrence in breast cancer.78 Leptin affects breast cancer biology in an endocrine, paracrine, and autocrine manner”(“Linkage Between Obesity Leptin and Breast Cancer”. Atoum MF, Alzoughool F, Al-Hourani H., Breast Cancer (Auckl). 2020 Jan 10;14:1178223419898458. doi: 10.1177/1178223419898458 ). This is a consistent with the results of our method regarding Increased Leptin level as a cause of Breast Cancer.
An article on role of estrogen in cancers states: “The oncogenic function of estrogens is considered in both classical and non-classical hormone-sensitive carcinomas such as prostate, breast, endometrial, lung, colon, and ovarian cancers . The molecular basis of cancer initiation by estrogen has been suggested through the production of aromatic estrogen metabolites (catechol estrogens quinones) that are derived from normally formed catechol estrogens. Chemically, depurinating DNA-adducts are formed by the reaction of 4-OHE1/2 or 2- OHE1/2 with Adenine/Guanine bases which leads to DNA mutations ”( “Estrogens and the risk of breast cancer: A narrative review of literature.”, Al-Shami K, Awadi S, et al, Heliyon. 2023 Sep 17;9(9):e20224. doi: 10.1016/j.heliyon.2023.e20224.). This is also consistent with our finding that an increased estrogen (beyond 1- sigma) is one of 4 required cause of Breast Cancer. It won’t cause Breast Cancer as a standalone though.
We have found that 4 physiological causes of Breast Cancer determined by the presented method are consistent with the existing research which was not used by the method before. This way we confirmed the steps we have taken were done correctly and our method’s results are correct.
A Room for an Error
So far we determined 4 physiological parameters changes beyond 1-sigma which must cause a breast cancer if they are taking place a the same time long enough. From a practical perspective it give us a room for an error in determination of these parameters. The disease cannot start unless 4 of them changed so if we determined 1 parameter incorrectly but 3 others correctly we still should be able to prevent the disease by controlling these 3 physiological parameters to be within 1-sigma interval. We also should be able to use these 3 parameters to treat or possibly even cure a disease in early stages.
The Supplementary Table 3 shows external factors which will cause Breast cancer if combined together. A combination of 4 of each factors from each column will cause Breast cancer in an individual. If the factors represent the 2 causes then the number of factors can be less accordingly. Using the Supplementary Table 3 we can conclude, for example, that if a women has Low Total Carotenes AND has Cystic Breast disease and High Breast Density (BI-RADS code 4) AND she is Postmenopause with Weight increased , BMI > 31.1 (1cs) such a women will get a Breast Cancer if she continuously has these factors. This is not optional, the only option to remove one or more of these factors to prevent the disease. We notice here that we have 4 disease causation factors here where each impacting only 1 physiological parameter so it goes beyond 1-sigma. These 4 physiological changes beyond 1-sigma at the end are causing breast cancer and not the disease causing factors them self. Using a Supplementary Table 3 we must combine disease causation factors in such a way that they impact all 4 physiological changes which were determined for Breast Cancer disease.
Diagram of Breast Cancer Triggering and BRCA1, BRCA2 role in its triggering
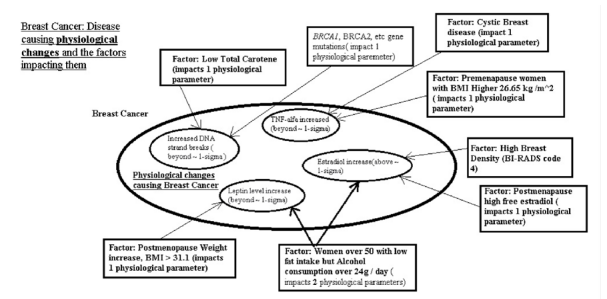
Figure 2:Breast Cancer Disease causing physiological changes and the factors impacting them
Mechanism of breast cancer pathology as result of our findings will look like on Figure. 2. From this diagram you can see that an increase of DNA strand breaks beyond 1-sigma (actually, slightly less) can be caused in different ways. One way is BRCA1, BRCA2, etc gene mutations is a causation factor for this increase. On another hand same increase in DNA strand breaks can be caused by low total carotenes. There can be other factors which impact the increase in DNA strand break beyond 1-sigma (approximately) as well.. What important here to notice is that it is not the gene mutation in BRCA1, BRCA2 by itself is a cause of Breast Cancer. The cause is the increase in DNA strand breaks and the gene mutation is one of causation factors for this increase but there can be many of them. Also, if there are BRCA1, BRCA2, etc. gene mutations then they are causing a change beyond 1- sigma in one physiological parameter only. This of course increases a risk of Breast Cancer development and it is widely known but it does not mean that Breast Cancer is inevitable as the triggering of it will happen only if all 4 physiological changes will be beyond 1-sigma (actually, slightly less) but mutation in BRCA1, BRCA2, etc. genes we can see only impact 1 out of 4 physiological changes required.
From this diagram we also can see that there are more powerful Breast Cancer causation factors exist which affect 2 physiological changes required to cause Breast Cancer. Such a factor as being a women over 50 with low fat intake but alcohol consumption over 24 g/day is causing changes to 2 physiological parameters so they go beyond 1-sigma (actually, slightly less). One of these physiological parameters is a leptin level increase beyond 1-sigma and the other is an estradiol increase beyond 1-sigma. The power of this factor to affect 2 physiological changes of course significantly increases the risk of disease due to alcohol consumption (under these conditions) but still is not enough to cause Breast Cancer as only 2 out of 4 physiological changes beyond 1-sigma (actually, slightly less) are taking place and this is not sufficient to trigger Breast Cancer. Still this can be used to prevent the individual from developing the Breast Cancer in future either by removing the factor - reducing / eliminating alcohol consumption or bringing the leptin level down using medication or other means. The important to notice here that mammogram will likely show nothing at this point as the Breast Cancer has not been triggered yet but by measuring the physiological changes we can predict the patient is moving toward Breast Cancer while being still healthy.
Building Hypothesis of Breast Cancer Pathology
Now when we determined 4 physiological changes beyond 1-sigma which are causing Breast Cancer we can demonstrate how the presented method simplifies building a hypothesis of disease pathology by connecting these found physiological changes together. We have determined using a method that Breast Cancer is caused by these 4 physiological changes : ”Increased DNA strand breaks” beyond 1-sigma, “Estradiol increase” beyond 1- sigma, “TNF-alfa increase” beyond 1-sigma, “Leptin Increase” beyond 1-sigma . Using existing research about these physiological parameters change we can build a relationship between them which will create hypothesis of Breast Cancer pathology as below.
Breast Cancer pathology (hypothesis): An increased beyond 1-sigma a number of DNA strand breaks (caused by such factors as low total carotene, etc) cannot be repaired due increased beyond 1-sigma TNF-alfa level (caused by Cystic Breast disease, for example) and an increased beyond 1-sigma level of leptin( caused by postmenopause women weight increase, BMI > 31.1, for example) where a leptin level increase reduces energy capabilities of breast cell in particular for repair processes and along with additional level of DNA mutations due to adducts created by high estradiol level beyond 1-sigma deprive the breast cell from the DNA repair capabilities required to compensate for a normal DNA degradation processes and DNA damages and mutation accumulate beyond control. This results in triggering of Breast Cancer. In short, the disruption of DNA damage / repair homeostasis leads to a breast cancer.
Results and Discussion
We introduced a method of finding non-infectious disease causes using multiple researches which give estimates of risks (RR/OR) for different factors in regards to the same specific non-infectious disease. Method starts with finding a number of disease causes using a formula (1.0) when we know a rate of this non-infectious disease in a population (often we use an incidence rate for this to see annual probability of the disease).
According to the method, once the disease causation factors were found using disease causation criteria provided in this article above we need to find out physiological parameters which are changed when these factors are present. The disease causation factors are selected from known risk factors for a non-infectious disease using the disease causation criteria. Once we list all disease causing factors vertically and physiological parameters related to them horizontally (or vice versa) we mark the relationship between related factors and physiological parameters changed with a letter “R”. Then we find so called intersections between 2 disease causation factors - the places where 2 different disease causation factors are having same physiological parameters marked as related with letter “R”. The physiological parameters are same by name (not by value).
We mark the column(or row) in gray or other color to indicate an intersection. We need to find all intersections like this. The physiological parameters where intersections are happening we list as matrix Pm. This list or matrix Pm is a superset of the physiological parameters changes which are causing a disease if their changes go beyond 1-sigma interval (actually, slightly less than this interval) and are present at the same time. By a superset we mean here that some parameters in a matrix Pm are disease causing but some may be just related to them and need to be eliminated (we call them such parameters redundant).
We eliminate the redundant parameters from this matrix Pm by using few rules of elimination and following a recommended algorithm if the count of parameters found exceeds the count determined by formula (1.0) calculating the number of disease causes or if a strict rule that a factor should cause only 1 change( or as determined by Disease Causation criteria) is broken.
One of these elimination rules is to check if the disease causation factors where intersection happens are related to each other (for example the same type of disease, or similar experiment like BMI and weight impact on disease, etc) and ignore the intersection for these factors as they are likely due to similarity. Another rule is to check if the physiological parameters for the same factors are related and this causing a change in 2 physiological parameters for the same disease causing factor as one valid physiological parameter is changing a dependent one. The dependent parameter need be eliminated from matrix Pm. Remember that most disease causation factors in practice are impacting only 1 physiological parameter change which is causing a disease. If we see a disease causation factor for which we determined only 1 physiological parameter change was found to be causing 2 or more changes in physiological parameters in our table (see example in Supplementary Table 1 or Table 2) then the redundant physiological parameters need to be eliminated using the elimination rules either from matrix Pm or from the table.
Table 1. (Areas in gray are where an intersections happen in parameters r12, r20 and r17 accordingly. Area surrounded by bold frame is a final set of parameters for matrix Pm)
| Factors causing Disease | Physiological Parameters - Entire Set for ALL FACTORS as R1, R2, ... Rn | ||||||||||||||
|---|---|---|---|---|---|---|---|---|---|---|---|---|---|---|---|
| r12 | r20 | r2 | r8 | r17 | r75 | r34 | r56 | r39 | r12 | r55 | r23 | r78 | r11 | ||
| Factor 1 | x | x | x | x | x | ||||||||||
| Factor 2 | x | x | x | x | x | ||||||||||
| Factor 3 | x | x | x | ||||||||||||
| Factor 4 | x | x | x | x | |||||||||||
Once the redundant parameters were eliminated we can check the final list of physiological parameters or matrix Pm using our criteria for disease causing factors (provided above for your reference) if there is an appropriate research regarding risks of these physiological parameters for the disease and confirm that we did not make any errors in steps of the described method. Also, we can use a related research regarding these found physiological parameters to see significance of their impact on the disease and this way to confirm correctness of method’s application and the significance of the found physiological parameters found via the described method.
As example of method’s application we analyzed Breast Cancer. We found that according to the method a Breast Cancer is caused by 4 physiological changes beyond approximately 1-sigma interval if they present at the same time. The disease must happen if the disease causing condition is satisfied for some time. We notice that Breast Cancer should not happen if only 1 of these parameters is beyond 1-sigma interval. We determined that the physiological parameters which are causing Breast Cancer if they changed beyond 1-sigma (actually, slightly less) are:
1. Increased DNA strand breaks ( beyond ~ 1-sigma )
2. TNF-alfa increased beyond ~ 1-sigma
3. Leptin level increase beyond ~ 1-sigma
4. High estradiol (above ~1-sigma)
By controlling 4(or only few of them) of these disease causation physiological changes we can prevent Breast Cancer in an individual or possibly cure ( if a disease in early stages) or treat it. If all the required physiological parameters changes take place at the same time the Breast Cancer must start after some time unless they are taken under control by forcing them to be within 1-sigma interval. In a healthy individual at least 1 or likely more of these physiological parameters need be close to a mean value ( be within 1-sigma interval).
We have determined a connection between different disease causation factors for Breast Cancer and these 4 physiological parameters (see Supplementary Table 2). From the Supplementary Table 2 we can conclude that “Low Total Carotene” disease causation factor for Breast Cancer is causing an increase in DNA strand breaks beyond 1-sigma and that is why it is 1 of few disease causation factors for Breast Cancer. The same impact has genetic mutations in BRCA1, BRCA2 genes as they also increase DNA strand breaks beyond 1-sigma. Cystic breast disease is one cause of Breast Cancer (see Supplementary Table 2) because it impacts TNF-alfa so it increases beyond 1-sigma. These factors mentioned will not cause Breast Cancer as standalone as they change only 1 physiological parameters beyond 1- sigma but to trigger Breast Cancer all 4 physiological parameters are required. The disease causation mechanism for Breast Cancer resembles a padlock with 4 wheels. If you turn 1 wheel the padlock will not open as you need to turn properly all 4 wheels. Once such a “padlock” open the disease will start. It must start no matter which disease causation factor “turned” the required wheel. The disease start because all the “wheels” turned properly and the factors are only the means to do it.
In the next step of the method we also divided disease causation factors for Breast Cancer in the groups according to a related physiological parameter they change beyond 1-sigma (see Supplementary Table 3). The presence of 1 such disease causation factor from each of these groups must trigger Breast Cancer in an individual if present together long enough. Using the Supplementary Table 3 we can conclude, for example, that if a women has Low Total Carotenes AND has Cystic Breast disease and High Breast Density (BI-RADS code 4) AND she is Postmenopause with Weight increased, BMI > 31.1 such a women must a Breast Cancer if she continuously has these factors. This happens because each of these factors impacts 4 physiological changes shown above so they go beyond 1-sigma. As we already mentioned if we eliminate an impact to at least 1 or better more physiological changes out these 4 provided above, either by removing presence of disease causation factor or by making sure that the physiological parameter it impacts stays within 1-sigma, we should be able to prevent Breast Cancer, treat it or possibly cure (in early stages).
The method allows to build easier a hypothesis of disease pathology using the physiological parameters we determined and we showed this on example of building hypothesis of Breast Cancer pathology.
Breast Cancer pathology hypothesis: An increased beyond 1-sigma a number of DNA strand breaks (caused by such factors as low total carotene, etc) cannot be repaired due increased beyond 1-sigma TNF-alfa level (caused by Cystic Breast disease, for example) and an increased beyond 1-sigma level of leptin( caused by postmenopause women weight increase, BMI > 31.1, for example) where a leptin level increase reduces energy capabilities of breast cell in particular for repair processes and along with additional level of DNA mutations due to adducts created by high estradiol level beyond 1-sigma deprive the breast cell from the DNA repair capabilities required to compensate for a normal DNA degradation processes and DNA damages and mutation accumulate beyond control. This results in triggering of Breast Cancer. In short, the disruption of DNA damage / repair homeostasis leads to a breast cancer.
The triggering of the non-infectious disease if the causation conditions are satisfied is not optional. It is a must.The analogy of this process could be an electrical fuse in a house. We know that if we plug in an electrical iron, air conditioner, etc. and exceed the threshold for the fuse the fuse will burn out. The fuse must burn out, it is not optional. The only random facts here are the electrical appliances which will cause it, these electrical appliances are an analogy of factors causing diseases here. We can have different external factors causing a non- infectious disease but as long as they impact all required physiological parameters a “fuse” of the body will burn out and the disease will start.
We need to notice here that multiple medical researches often find risk factors for a specific disease which have values close to RR/OR = 4.6 or RR/OR = 20.6. These are not just a statistically significant risks but these numbers indicate that 1) the factors are really disease causing factors 2) the factors are causing a change in 1 physiological parameter beyond 1-sigma (for RR/OR = 4.6) or 2 physiological parameters beyond 1-sigma (for RR/OR = 20.6). One example of these cases was shown in this article as an alcohol consumption by women between 50-59 age (RR = 18) in Supplementary Table 2 and which is a disease causation factor for a Breast Cancer which impacts 2 physiological changes, etc . In some rare cases the risk factors can have RR/OR=93+/-50% and this means the disease causing factors are impacting 3 physiological parameters beyond 1-sigma. The disease causation criteria provided in article “A Connection between Factors Causing Diseases and Diseases Frequencies: Its Application in Finding Disease Causes” (Alan Olan, Journal of Clinical Trials, Vol.13, Issue 4) allows to determine more precisely if the risk factors are causing a disease or not and allows to expand validity for these risks beyond the 2 examples of RR/OR just mentioned above. The referred article is using a risk factor K but it is easily converted to RR/OR as RR = K + 1 (same for OR) and the RR/OR can be used as the theoretical values for RR/OR +/-50%. A short reference of these criterions was provided in this article as well in Introduction section.
In this article we have shown that disease causation factors can be separated into few groups according to a physiological parameter they change beyond 1-sigma. Any combination of factors taken as one from each of these groups must cause a non-infectious disease. The real causes of the non-infection disease is a set of changes of certain physiological parameters beyond 1-sigma (slightly less, actually) and the disease causation factors are only means to make these changes.
There can be many different disease causation factors but only few (2 or more ) physiological changes beyond 1-sigma which are required to cause a non-infectious disease.
Principle of Indifference
As we discuss a method to find disease causes via experiments we are proposing to use a simple principle which can be observed in physiological processes. When regulating its own homeostasis separate physiological systems of the body are indifferent to the side effects of this regulation. We can call this a principle of indifference.
We can observe this principle in multiple cases. For example, if a brain needs to increase a blood pressure to improve a supply of nutrients and oxygen it is indifferent to the fact that a heart may not be able to sustain this high blood pressure. Another example could be this. If an intestine is trying to regulate its homeostasis of bacteria it can pass the signals to the brain via different biochemical pathways to reduce appetite so in this case an intestine is indifferent to that its actions can eliminate some source of energy and needed nutrients to the brain and other systems and worsen their functioning.
This principle allows to explain that supporting a homeostasis in one physiological system of the body can and often does harm functioning of other systems and this way it can cause a non-infectious diseases. If we find a physiological system which is regulating its homeostasis with extreme steps and help it to fix the problems we can address a non-infectious disease of another physiological system which can be caused by this indifference.
Conclusions
1. In this article we have showed how a research which estimate a risk of non-infectious disease can be used to determine disease cause as a set of physiological parameters changes beyond 1-sigma (actually, slightly less than this interval). We showed how to determine which physiological parameter is impacted by a specific external factors. It was shown how certain different combinations of external factors can cause a disease if they act together and how to determine these disease causing factors combinations.
2. We demonstrated the application of a novel method of finding non-infectious disease causes to a Breast Cancer and have determined a unique set of 4 physiological changes beyond 1-sigma (actually, slightly less) which must trigger Breast Cancer if these changes are present together long enough. We also discovered multiple disease causation factors which are causing changes to these 4 physiological parameters in such a way so they go beyond approximately 1-sigma interval.
3. This research shows that there are many disease causation factors for Breast Cancer but disease start because of the unique set of physiological changes occurring in the body at the same time and present long enough.
1. The research also has shown that majority of disease causation factors for Breast Cancer can change only one physiological parameter of required 4 and only rare factors can change 2 physiological parameters so they go beyond 1-sigma.Which is in practice researchers find as a risk increase for Breast Cancer. In other words the disease causation factors have different power in causing the disease.
2. In author’s view the knowledge of unique physiological changes which are causing Breast Cancer and a set of found disease causation factors which are causing this changes can be potentially effectively used in prevention of Breast Cancers in population, in its treatment or even in its cure in early stages. The knowledge of physiological changes which already occurred can be used to determine if the individual while being still healthy is getting closer to Breast Cancer triggering. We should be able to see Breast Cancer is developed far before we can see it on a mammogram and take corrective action either by eliminating the found disease causation factors or bringing the physiological changes within 1-sigma interval (actually, slightly less) by using medication or other means.
3. Overall a method presented here allows to increase efficiency of existing medical research in finding non- infectious disease causes and also stresses that non-infectious disease are having a multi-factorial causes. These causes are multiple physiological parameters changes beyond 1-sigma occurring at the same time and happening due to actions of external disease causing factors.
Funding Statement
This work was carried out by the author as an independent research
Ethical Compliance
All procedures performed in studies involving human participants were in accordance with the ethical standards of the institutional and/or national research committee and with the 1964 Helsinki Declaration and its later amendments or comparable ethical standards.
Conflict of Interest
The authors declare that they have NO affiliations with or involvement in any organization or entity with any financial interest in the subject matter or materials discussed in this manuscript. Author Contributions: Alan Olan is the sole contributor to this study
Disclaimer
This work is not intended to be used in diagnosing and treatment of any disease in any patient, those actions should be done by qualified professionals only. The work is intended as a reference for the researchers only. The author is not responsible for any issues created by unintentional usage or consequences of this work.
References
1. Olan A. A connection between factors causing diseases and diseases frequencies: its application in finding disease causes. J Clin Trials. 2023;13(4).
2. Olan A. Method of combining multiple researches to determine non-infectious disease causes, analysis of depression and celiac disease causes. Biol Med (Aligarh). 2024;16(1):1000635.
3. Hotamisligil GS, Spiegelman BM. Tumor necrosis factor α: a key component of the obesity-diabetes link. Diabetes. 1994 Nov;43(11):1271–8. doi: 10.2337/diab.43.11.1271.
4. Madej P, Franik G, Kurpas P, et al. Evaluation of adipokines, inflammatory markers, and sex hormones in simple and complex breast cysts’ fluid. Dis Markers. 2016;2016:5174929. doi: 10.1155/2016/5174929.
5. Tran DD, Lawson JS. Microcysts and breast cancer: a study of biological markers in archival biopsy material. Breast Cancer Res Treat. 2002 Oct;75(3):213–20. doi: 10.1023/a:1019969730552.
6. Celis JE, Gromov P, Moreira JMA. Apocrine cysts of the breast: biomarkers, origin, enlargement, and relation with cancer phenotype. Mol Cell Proteomics. 2006 Mar;5(3):462–83. doi: 10.1074/mcp.M500348-MCP200.
7. Hirko KA, Spiegelman D, Willett WC, et al. Relation to plasma sex hormones, prolactin, and sex hormone–binding globulin in premenopausal women. Cancer Epidemiol Biomarkers Prev. 2014 Dec;23(12).
8. Roth MJ, Baer DJ, et al. Relationship between serum leptin levels and alcohol consumption in a controlled feeding and alcohol ingestion study. J Natl Cancer Inst. 2003 Nov 19;95(22):1722–5. doi: 10.1093/jnci/djg090.
9. Trius-Soler M, Praticò G, Gürdeniz G, et al. Biomarkers of moderate alcohol intake and alcoholic beverages: a systematic literature review. Genes Nutr. 2023;18:7. doi: 10.1186/s12263-023-00726-1.
10. Cho BA, Iyengar NM, Zhou XK, Morrow M. Blood biomarkers reflect the effects of obesity and inflammation on the human breast transcriptome. Carcinogenesis. 2021 Oct 26;42(10):1281–92. doi: 10.1093/carcin/bgab066. PMID: 34314488; PMCID: PMC8546933.
11. Gabrielson M, Azam S, Hardell E, et al. Hormonal determinants of mammographic density and density change. Breast Cancer Res. 2020 Aug 26;22(1):95. doi: 10.1186/s13058-020-01332-4.
12. Chen JH, Hsu FT, Shih HN, et al. Does breast density show difference in patients with estrogen receptor-positive and estrogen receptor-negative breast cancer measured on MRI? Ann Oncol. 2009 Aug;20(8):1447–9. doi: 10.1093/annonc/mdp362.
13. His M, Lajous M, Gómez-Flores-Ramos L, et al. Biomarkers of mammographic density in premenopausal women. Breast Cancer Res. 2021;23:75.
14. Dicato M, Plawny L, Diederich M. Anemia in cancer. Ann Oncol. 2010 Oct;21(Suppl 7):vii167–vii172. doi: 10.1093/annonc/mdq284.
15. Bhardwaj P, Bareja R, Oshchepkova S, et al. Leptin mediates obesity-induced DNA damage in BRCA1 breast epithelial cells. J Endocr Soc. 2021;5(Suppl 1):A1024. doi: 10.1210/jendso/bvab048.2095.
16. Institute of Medicine. Dietary reference intakes for vitamin C, vitamin E, selenium, and carotenoids. Washington (DC): National Academies Press (US); 2000. Chapter 8, β-Carotene and other carotenoids. Available from: https://www.ncbi.nlm.nih.gov/books/NBK225469/
17. Gottlieb K, Zarling EJ, et al. β‐Carotene decreases markers of lipid peroxidation in healthy volunteers. Nutr Cancer. 1993;19(2):207–12. doi: 10.1080/01635589309514251.
18. National Institutes of Health. Vitamin A and carotenoids. Fact sheet for health professionals. Available from: https://ods.od.nih.gov/factsheets/VitaminA-HealthProfessional/
19. National Library of Medicine. BRCA1 gene. MedlinePlus. Available from: https://medlineplus.gov/genetics/gene/brca1
20. Mylavarapu S, Das A. Role of BRCA mutations in the modulation of response to platinum therapy. Front Oncol. 2018;8:16. doi: 10.3389/fonc.2018.00016.
21. Cahill AG, Mathur AM, et al. Impact of maternal insulin dependent diabetes mellitus (IDDM) on offspring neurodevelopment. Am J Obstet Gynecol. 2017 Jan;216(1 Suppl):S56. doi: 10.1016/j.ajog.2016.11.965.
22. Hotamisligil GS, Spiegelman BM. Tumor necrosis factor alpha: a key component of the obesity-diabetes link. Diabetes. 1994 Nov;43(11):1271–8. doi: 10.2337/diab.43.11.1271. PMID: 7926300.
23. Xie J, Huang L, Li X, Li H, et al. Immunological cytokine profiling identifies TNF-α as a key molecule dysregulated in autistic children. Oncotarget. 2017 Jul 18;8(47):82390–8. doi: 10.18632/oncotarget.19326. PMID: 29137272; PMCID: PMC5669898.
24. Pietropaolo M, Barinas-Mitchell E, et al. The heterogeneity of diabetes: unraveling a dispute—is systemic inflammation related to islet autoimmunity? Diabetes. 2007 May;56(5):1189–97. doi: 10.2337/db06-0880.
Received: February 17, 2025;
Accepted: March 24, 2025;
Published: March 28, 2025 .
To cite this article : Olan A. A Unique Set of Physiological Changes Which Causes Breast Cancer: A discovery with a novel method of finding non-infectious disease causes which combines multiple research. British Journal of Cancer Research. 2025; 8(2): 778- 793. doi: 10.31488/bjcr.205.
© The Author(s) 2025. This is an open access article distributed under the terms of the Creative Commons Attribution License (https://creativecommons.org/licenses/by/4.0/).